Growing up in Alexandria, Egypt, Dr. Mohamed Elgendi knew he wanted to make a difference and help others. Despite facing steep odds after being orphaned at a young age, Dr. Elgendi earned a PhD in biomedical engineering and now pursues innovative research projects as a UBC postdoctoral fellow supervised by Dr. Kenneth Lim and Dr. Rabab K. Ward. His research is supported by a BC Children’s Hospital Research Institute Mining for Miracles Postdoctoral Fellowship.
Dr. Elgendi also teaches workshops across North American and Europe on the visual presentation of scientific data and, in October 2017, published a piece in Nature Biotechnology about the importance of data visualization for scientists. Dr. Elgendi was recently named an editor of the journal Diseases, and will edit an upcoming special issue: “Non-invasive Diagnostics for Cardiovascular Diseases.”
Dr. Elgendi talks about how his unique experiences as an engineer working in health care have inspired him to explore creative ways to share complex science and use innovative technology to ensure that pregnant women receive optimal care, giving their children the best possible start in life.
You teach popular workshops on “data visualization.” What is it and why is it important?
Data visualization refers to the images, charts and graphs used to present data. These visuals have the potential to simply and powerfully communicate complex information, allowing researchers to share their findings with scientific experts in different areas and with the general public. Most researchers use some form of data visualization, but we don’t always give a lot of thought to how we can make it intuitive and easy to understand for a variety of audiences.
To give an example, let’s say you do research showing that 30 per cent of deaths are caused by a certain disease. Rather than reporting the percentages with a bar or pie chart, which may not represent the 1/3 ratio in a way that’s easy to immediately see, you could use an infograp
hic with three human figures, and colour two using one colour and one using a different colour. Which visual is easier to understand at a glance? Which would have the greater impact on the most people?
In my workshops, I incorporate the science of how humans perceive shapes and colours and process images in order to help researchers present their work using the most effective visuals possible.
How did you become interested in data visualization?
While I was studying for my master’s degree and PhD in biomedical engineering at Charles Darwin University in Australia, I did a project on firefighters in partnership with the Royal Darwin Hospital and the Northern Territory Fire and Rescue Service. We were measuring firefighters’ heart and lung function to determine how well each person could manage extreme heat. The goal was to develop tests to help fire departments evaluate potential recruits. I had to think of ways to communicate progress and results to non-researchers and began to develop visualizations that were intuitive and understandable.
Before this project, I worked mainly with other engineers. At the hospital, I had to share my research with doctors, engineers, nurses and firefighters. I’d show charts I made to my engineering supervisor and he’d think they were fine, but then I’d show them to a firefighter and he’d say, “Sorry, I don’t follow.” I realized I wasn’t giving enough thought to the visuals I was using to present data. I should have been speaking a visual language everyone could understand, instead I was talking in a way that could only be understood by other specialists in my field.
This realization was reinforced during my time at Nanyang Technological University, Singapore. During my two years there, I worked in a multi and interdisciplinary team and routinely had to communicate concepts and results between psychology, neuroscience, engineering and computer science departments. As my career progressed and I moved to Alberta and then to BC, I consistently saw a need for effective data visualization to facilitate knowledge translation and impactful communication.
Effective data visualization can help researchers communicate their findings. Could it potentially help doctors share information with patients?
Yes, there’s potential for that. For example, if you look at a chart that measures brain activity, unless you’re a neurologist, it just looks like scribbles. Imagine if we could translate these visuals into something intuitive and artistic to share with patients and their families when explaining test results; for example, a flourishing tree might represent healthy brain activity. Data visualization isn’t just about working with figures and pictograms, it’s about taking noisy, complex data and turning it into something almost anyone can understand.
What are you working on in your own research?
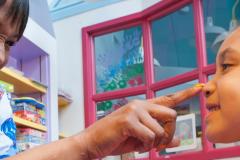
In my main research project, which is supported by a BC Children’s Hospital Research Institute Mining for Miracles Postdoctoral Fellowship, I’m developing a better way to screen for preeclampsia, a dangerous pregnancy complication characterized by the sudden onset of high blood pressure. Preeclampsia can lead to uncontrollable seizures and organ failure that put both mother and baby at extreme risk. I’m exploring how to use pulse oximeters – non-invasive devices that measure a person’s blood oxygen level using a sensor placed on the finger – to test women for this condition.
Right now health care workers use blood and urine tests to screen for preeclampsia, but a less invasive, less expensive test would make it easier to monitor women for this devastating condition, particularly in developing countries, and rural and remote locations.
Why did you decide to work in biomedical engineering?
I chose to work in the medical field, as opposed to another area of engineering, because I wanted to see my research directly impact people’s lives by creating devices and techniques that improve the quality of health care and consequently the quality of life for patients. I lost my parents at a young age. Growing up the most rewarding feeling for me was when I could help a family stay together and be in good health, whether my contribution was small or big. This sentiment influences everything I do. I don’t collect a fee for my data visualization workshops because my main goal is to help other researchers share their work as effectively as possible.